All posts by Aztocas

Final Electoral Forecast Including Most Likely Path to Victory for Clinton and Trump

Tonight’s outcome will all come down to how the electoral map plays out, and more specifically it is really contingent on the outcome of just 13 states.

Each candidate has their “safe” states:

Clinton’s Safe States:  Clinton currently has 18 safe states (in order of likelihood): DC, MD, CA, MA, NY, HI, IL, VT, WA, NJ, CT, OR, RI, DE, MN, VA, WI, NM for a total of 220 electoral votes.  Donald Trump still believes he can win MN, VA, WI, and NM, but polls would suggest otherwise.  If he wins those states, it would be in a landslide Trump victory.

Trump Safe States: Trump currently has 20 safe states (in order of likelihood): OK, AL, WV, AR, KY, LA, ID, WY, MS, NE, TN, ND, IN, KS, MO, UT, MT, TX, SD, and SC for a total of 161 electoral votes. It is unlikely that Clinton wins any of these states although the Hispanic vote (38% of Texas’ population is Hispanic) could swing that state in a Clinton landslide.

That leaves 13 states up for grabs.

Clinton’s easiest path to victory: Clinton needs 50 more electoral votes to win. In order, here are the most likely

  • ME 4
  • MI 16
  • PA 20
  • CO 9
  • NH 4

This path shows why it’s much easier for Clinton to win: assuming the above happens, Trump can win NV, FL, NC, and OH and still lose.

Trump’s easiest path to victory: Trump needs 109 more electoral votes to win.  In order, here are the most likely:

  • GA 16
  • AK 3
  • IA 6
  • AZ 11
  • OH 18
  • NC 15
  • FL 29
  • NV 6
  • NH 4
  • CO 9

The good news for Trump is he doesn’t need PA or MI.  The bad news is he needs almost everything else.

Final Projection:

Of the 13 states in play, the forecast has Clinton winning 7 (ME, MI, PA, CO, NH, NV, and FL) for 88 votes and Trump winning 6 (NC, OH, AZ, IA, AK, GA) for 69 votes.  That puts the final projection at Clinton 308 and Trump 230.

Please check out our Election Day Electoral Tracker for updated results


Views – 813

Updated Poll of Polls: Clinton Stabilizes Small Lead over Trump Just Ahead of the Election

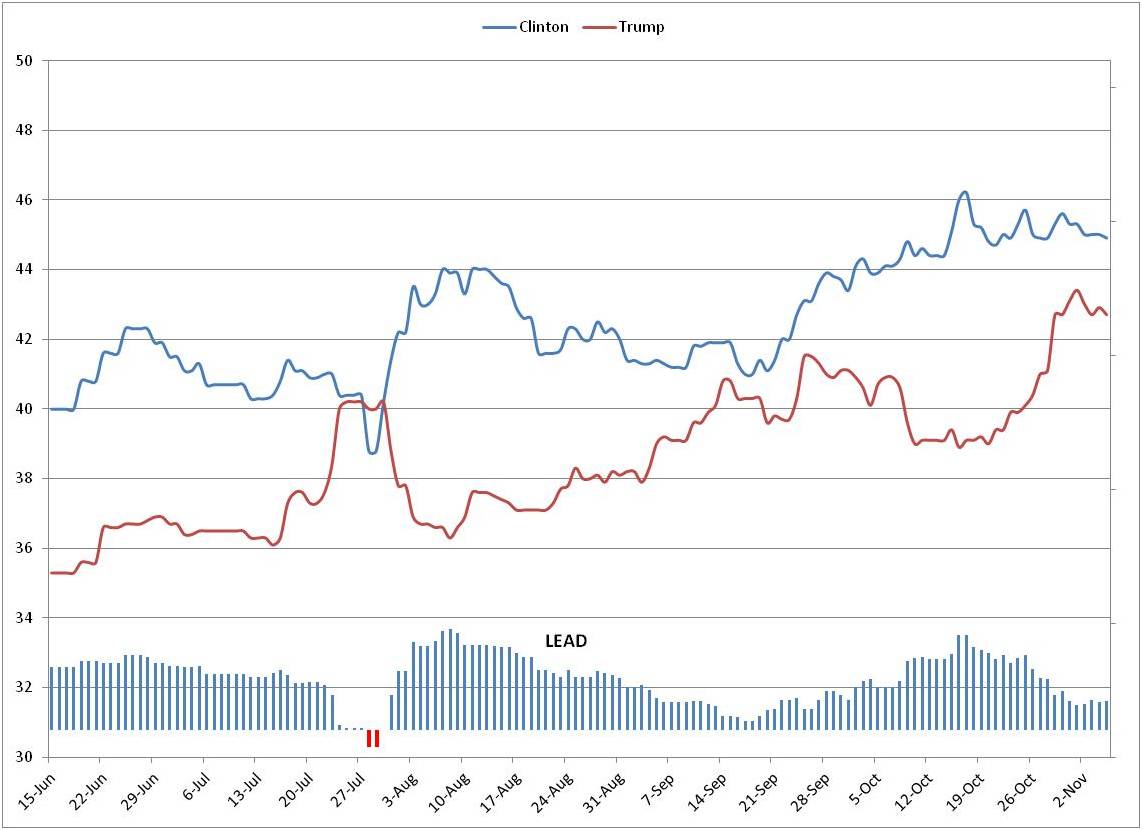
The damage from the Comey letter has become very clear, and its impact seems to be around 2.5%-3.0%:  The letter was released on Friday and Clinton had a lead of about 3.8%-3.9% on that Thursday and Friday.  By Monday the lead was down to 2.1% and it has bounced between 1.9% and 2.3% the last 6 days.  The current Clinton lead is at 2.2%.  What’s interesting in the polls is both candidates have recently declined.  Last Monday it was Clinton 45.3% and Trump 43.1%.  On Saturday it’s 44.9% to 42.7%.

Here is a trend of the polls:

poll-of-polls-last-11-7-16

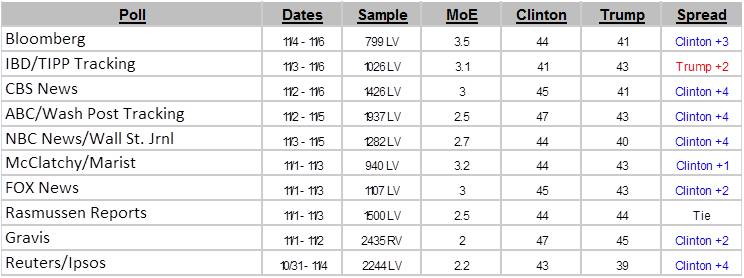
Here are the last 10 polls:

poll-of-polls-last-10-11-7-16

Of course the election is not about national polls and popular votes.  It’s about the electoral college.  Please see previous posts or click below for updated  state by state forecast of the electoral outcome.

Click here for a state by state forecast of the elections

Click here for running list of forecast changes

Click here for results from last 5 elections

Follow me @2016ElectOdds for updates

Methodology:

  • Use national polls listed at Real Clear Politics
  • Weigh the outcomes by the sample size of each poll
  • Account for the different days spanned for the poll by allocating it out across the days.
  • Example a poll of 1000 voters taken across 7/2-7/5 would have a weighting of 250 voters for each of those days
  • For each day, take the previous weighted 7 days worth of poll data to compute a percentage for each candidate.  The rolling 7 days decreases the impact of large polls taken on a single day (large sample electronic polls)

Views – 852

Updated Electoral Forecast: Trump Gets Closer to Clinton as OH, NV, AZ, IA, and NH Appear to be Leaning R; Clinton Appears to Lead in FL

Donald Trump continued to close the electoral gap this week by moving some of the tossup states into his column, increasing his lead in some states, and narrowing the lead in some of the states that Hillary Clinton leads.

The biggest impact came in states that were tossup last week that now seem to be leaning towards Trump including:

  • OH (Trump +5, +4, tie)
  • NV (Trump +6,  +4, tie)
  • AZ (Trump +4, +5, +5)
  • IA (Trump +1, +3, +7)
  • NH (Trump +5, +2, tie)

States where Trump already leads and where he increased  his odds included:

  • Solidifying TX after his lead shrank.  The last three polls have him up +13,  +9, and +14
  • Moving UT from lean R to solid R with the last three polls coming in at +6, +12, +5

States that Clinton leads in where Trump has narrowed her gap:

  • VA (Clinton +4, +7, +5)
  • ME (Clinton +4, +5, +11)
  • MI (Clinton +3, +4,  +5)
  • NM (Clinton +4, +13, +3)

Clinton made some progress in two must win states for Trump.  It looks like she might have a slight edge in FL which was previously a tossup given the last three polls (Clinton +2, +1, +4).  She has also narrowed his lead in once solid R GA (Trump +1, +4, +2).

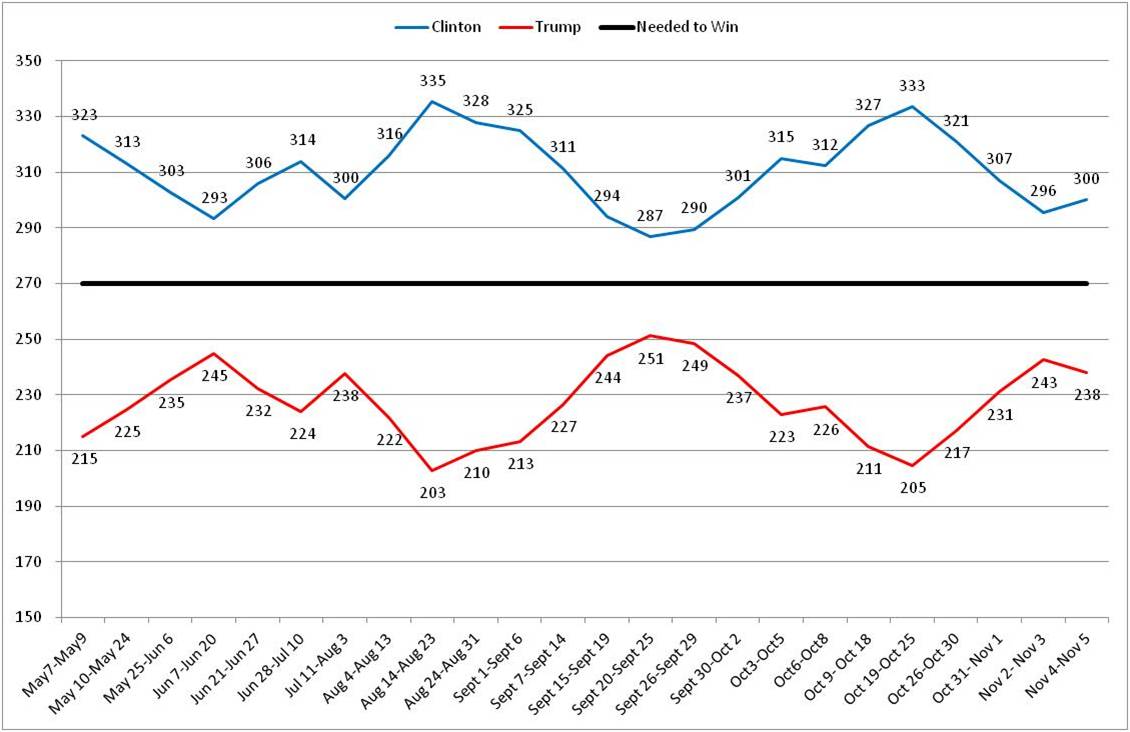
These gains have closed the forecast gap to the current 300 to 238 from the previous 311 to 222.  Trump got as close as  294-244 on 11/2.  That was the closest he has been since 9/29 (289-249).

The list of tossups has shrunk from last week’s 5 to just 1 (NC)

Many once thought to be tossup states currently have Clinton in front including:

  • CO
  • FL
  • PA
  • VA
  • WI

Trump has done a great job over the last week to swing some of the tossup states to his side including:

  • IA
  • NV
  • OH
  • NH

Here’s a trend of the forecast:

electoral-forecast-trend-11-6-16

  • Click here for a state by state forecast of the elections
  • Click here for running list of forecast changes
  • Click here for results from last 5 elections
  • Follow me @2016ElectOdds for updates

Views – 832