All posts by Aztocas

Updated Poll of Polls: Aided by Bump from DNC and Missteps by Trump, Clinton Reclaims National Lead

It’s been a week since Donald Trump caught Hillary Clinton in the poll of polls (and passed her in several polls).  Since then the trend has reversed with Clinton receiving a bump from the DNC and Trump being involved in a controversies with the Khan family and his views on Ukraine and Russia.

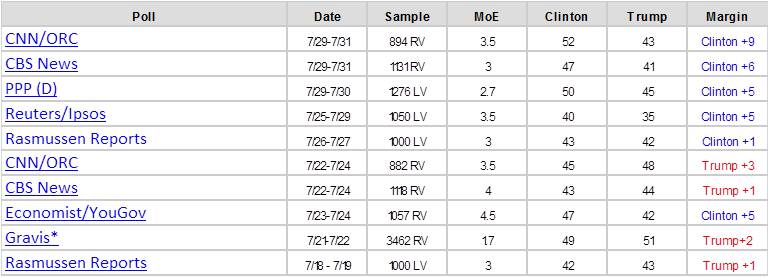
Clinton has won the 5 reputable polls taken since the start of the  DNC, with the two biggest wins coming in the two polls post the DNC and the start of the Khan controversy.

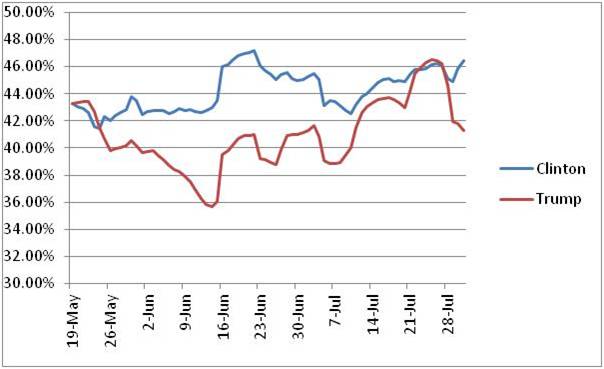
The poll of polls has her now leading by 5.1% (46.4% to 41.3%), her biggest lead since 6/27.

Here is a trend of the polls:

poll of polls trend 7-31

Here are the last 10 polls used in the tracking:

poll of polls 7-31

Of course the election is not about national polls and popular votes.  It’s about the electoral college.  Please see previous posts or click below for updated  state by state forecast of the electoral outcome.

Click here for a state by state forecast of the elections

Click here for running list of forecast changes

Click here for results from last 5 elections

Follow me @2016ElectOdds for updates

Methodology:

  • Use national polls listed at Real Clear Politics
  • Weigh the outcomes by the sample size of each poll
  • Account for the different days spanned for the poll by allocating it out across the days.
  • Example a poll of 1000 voters taken across 7/2-7/5 would have a weighting of 250 voters for each of those days
  • For each day, take the previous weighted 7 days worth of poll data to compute a percentage for each candidate.  The rolling 7 days decreases the impact of large polls taken on a single day (large sample electronic polls)

Views – 741

Updated Electoral Forecast: Unlike in National Polls, Clinton Widens Lead in Electoral Forecast

In the last three weeks, Donald Trump has caught and passed Hillary Clinton in most national polls.  That, however, has not translated to Trump closing the gap on Clinton from an electoral college perspective.

Trump seems to have gained on Clinton in states that are solid D (Example closing the gap in CA from +30 Clinton to +16 Clinton) but not in battleground states like PA (latest poll shows Clinton +9)

Since the last update, there were three states that showed movement:

  • A GA poll of Trump +2 moved the state from likely R to lean R.  The previous 2 polls were Trump +7 and Trump +3 for an average of Trump +4
  • A PA poll of Clinton +9 moved the state from tossup to lean D.  The previous two polls were Trump +6 and Clinton +8 for an average of Clinton +4.  With Clinton leading the last two polls, it’s clear she has momentum in the state.
  • Two MO polls came out.  The first confirmed Trump +10  moving the state from likely R to solid R.  The  second was a surprise with Clinton +1.  That was enough to move the state back from solid R to likely R.

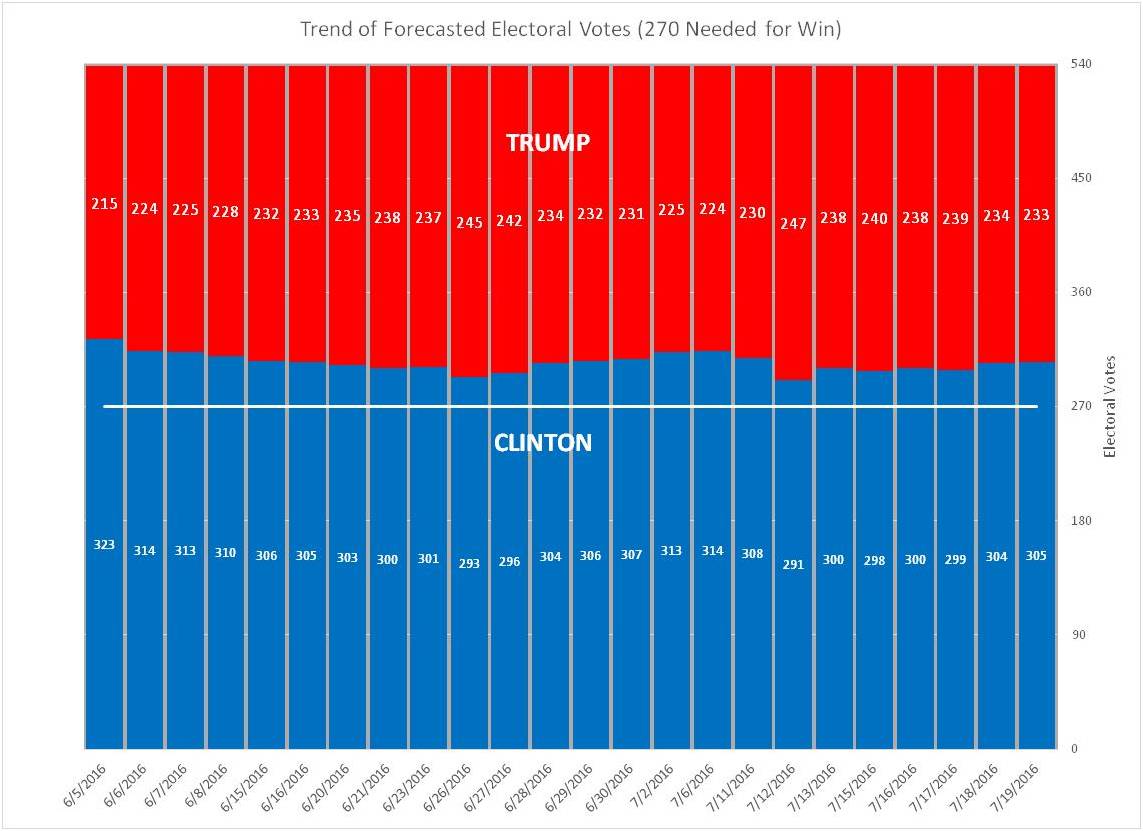
The above moved the forecast from the previous 298-240 Clinton to the current 305-233 Clinton.  The 72 point lead is the largest since 7/12.

Other polls during the period:

  • ID Poll Trump +21 confirms state as solid R
  • NH Poll Clinton +2 confirms state as lean D
  • 2 OH Poll tie confirms state as tossup
  • MI Poll Clinton +6 confirms state as lean D
  • NV Poll Trump +5 confirms state as tossup
  • KS Poll Trump +17 confirms state as solid R
  • VT poll Clinton +22 confirms state as solid D
  • DE poll Clinton +10 confirms state as solid D
  • OR poll Clinton +3 confirms state as lean D
  • CA Poll Clinton +16 confirms state as solid D

Here’s a trend of the forecast:

electoral trend 7-31-16

Click here fora state by state forecast of the elections

Click here for running list of forecast changes

Click here for results from last 5 elections

Follow me @2016ElectOdds for updates

Views – 735

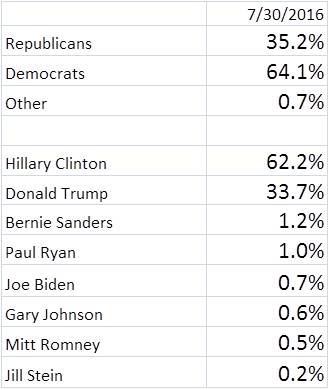
Updated Weekly Odds: Trump Momentum Continues; Clinton Still Leading Odds Despite Falling Behind in National Polls

For the fifth straight week, Donald Trump has closed the lead on Hillary Clinton.  This week Trump was up 2.5% to 33.7%, his all time high (previous was 32.9% at the end of May).

Conversely Hillary Clinton dropped for the fifth straight week  from 64.1% to 62.2%, her lowest in 8 weeks. She has declined the last three weeks.

“Others” which include official candidates Jill Stein and Gary Johnson as well as Mitt Romney, Paul Ryan, Joe Biden, and Bernie Sanders, continued to drop as a group.  They are now at 4.1% from 4.7% the previous week.

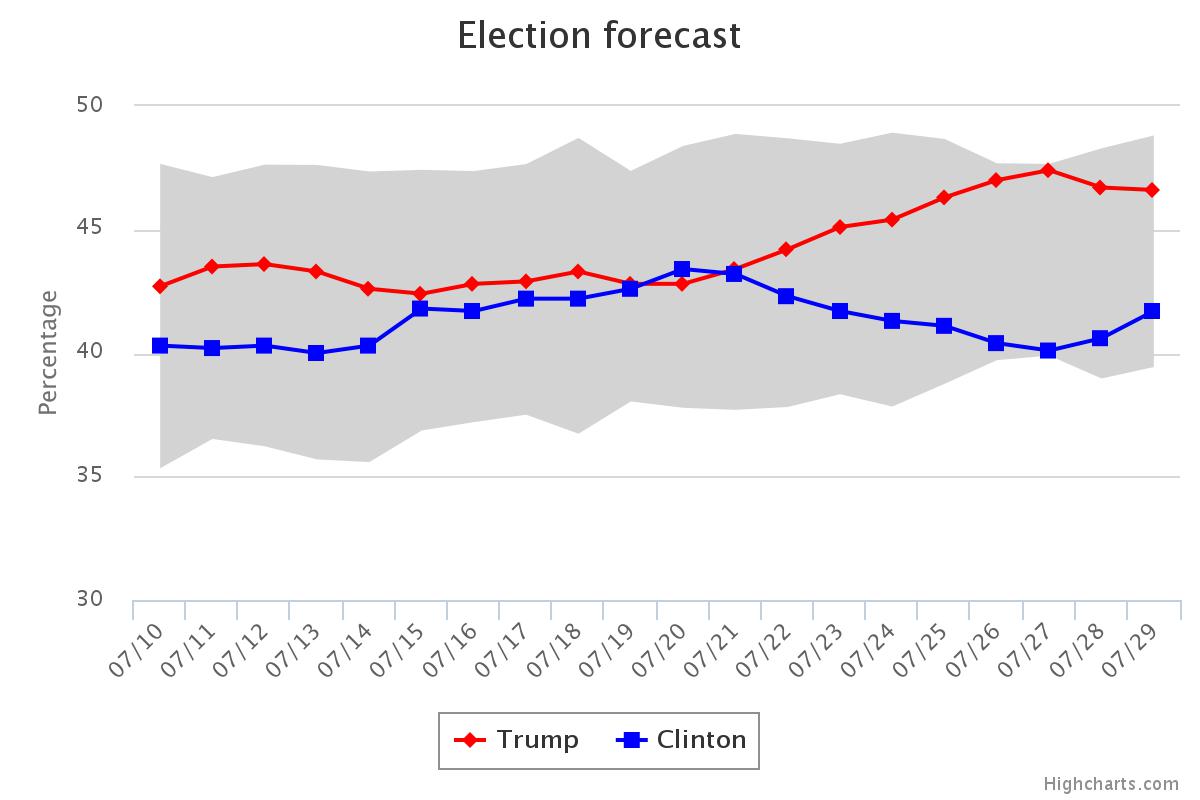
Donald Trump has passed Hillary Clinton in most recent national polls.  As an example, here’s a daily trend of the USC/LATimes poll (election.usc.edu)

election trend

Why has that national poll lead not translated to the odds?  That is probably due to the fact that the national polls are more reflective of the popular vote while betting odds are more reflective of the electoral college.  Clinton continues to have an easier “Electoral map” than Trump, although that gap has been closing as well.  Click here for a state by state electoral forecast of the elections.  This will be updated tomorrow with post DNC polls.

Here’s the full standings:

election odds 7-30-16

Click here for a state by state forecast of the elections

Click here for running list of forecast changes

Click here for results from last 5 elections

Follow me @2016ElectOdds for updates

Views – 786