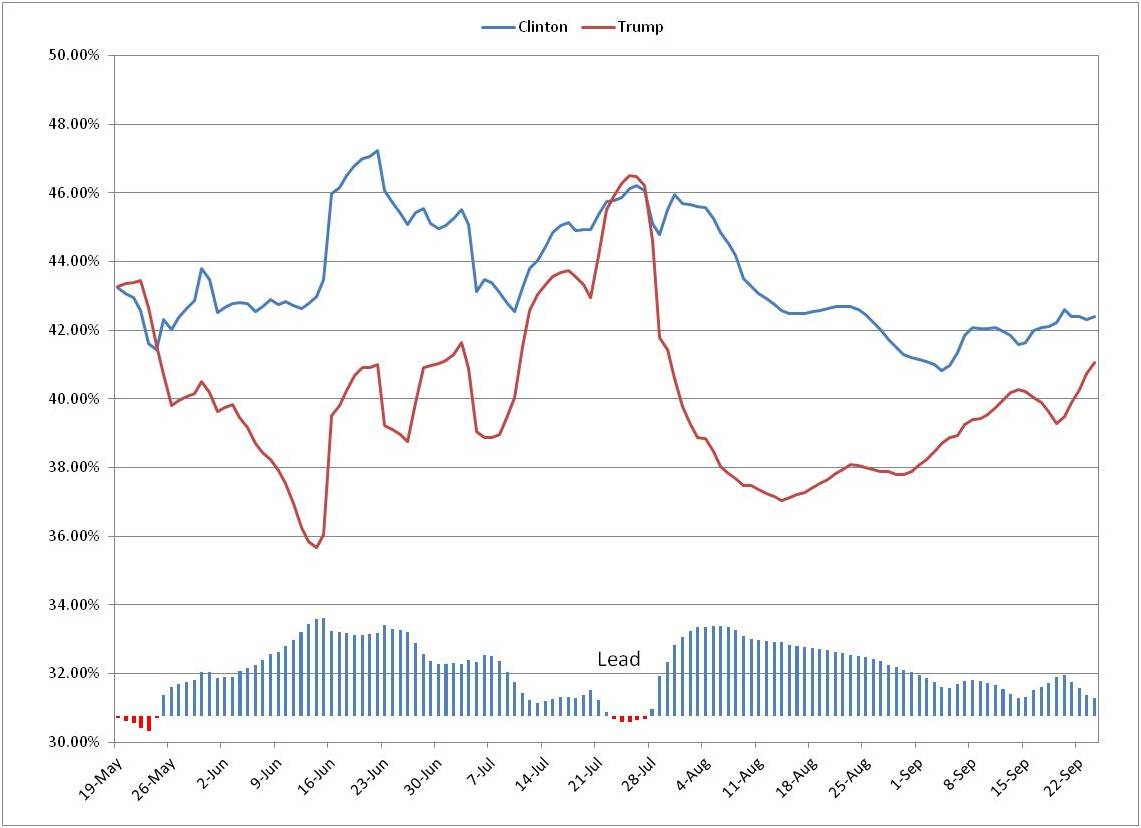
Over the last two months there have been two major moves in the polls: Clinton’s meteoric rise coming from behind to being up by nearly 7% in the span of a week post DNC in late July and Trump’s consistent gains throughout August and September that peaked with Clinton’s pneumonia episode.
Since then there have been to micro-trends amidst volatile polls. Originally it appeared Clinton was gaining back her momentum, improving her 1.3% lead to 3.1% in the span of a week. That small trend reversed and Trump seems to be gaining ground over the last 5 days and is now only 1.3% back again. Trump was last this close on 7/28 which is when Clinton began gaining her post DNC jump. It will be interesting to see whether this first debate causes a jolt to get us out of this 1%-3% Clinton lead.
Here is a trend of the polls:
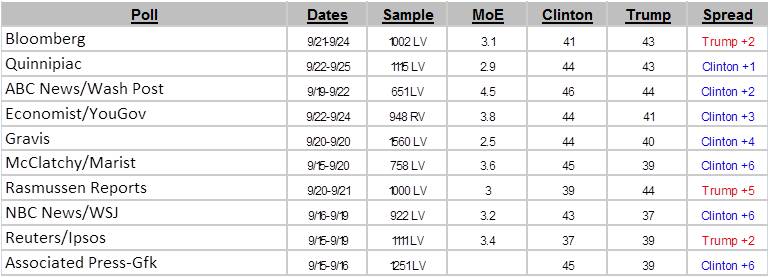
Here are the last 10 polls:
Of course the election is not about national polls and popular votes. It’s about the electoral college. Please see previous posts or click below for updated state by state forecast of the electoral outcome.
Click here for a state by state forecast of the elections
Click here for running list of forecast changes
Click here for results from last 5 elections
Follow me @2016ElectOdds for updates
Methodology:
- Use national polls listed at Real Clear Politics
- Weigh the outcomes by the sample size of each poll
- Account for the different days spanned for the poll by allocating it out across the days.
- Example a poll of 1000 voters taken across 7/2-7/5 would have a weighting of 250 voters for each of those days
- For each day, take the previous weighted 7 days worth of poll data to compute a percentage for each candidate. The rolling 7 days decreases the impact of large polls taken on a single day (large sample electronic polls)
Views – 668

