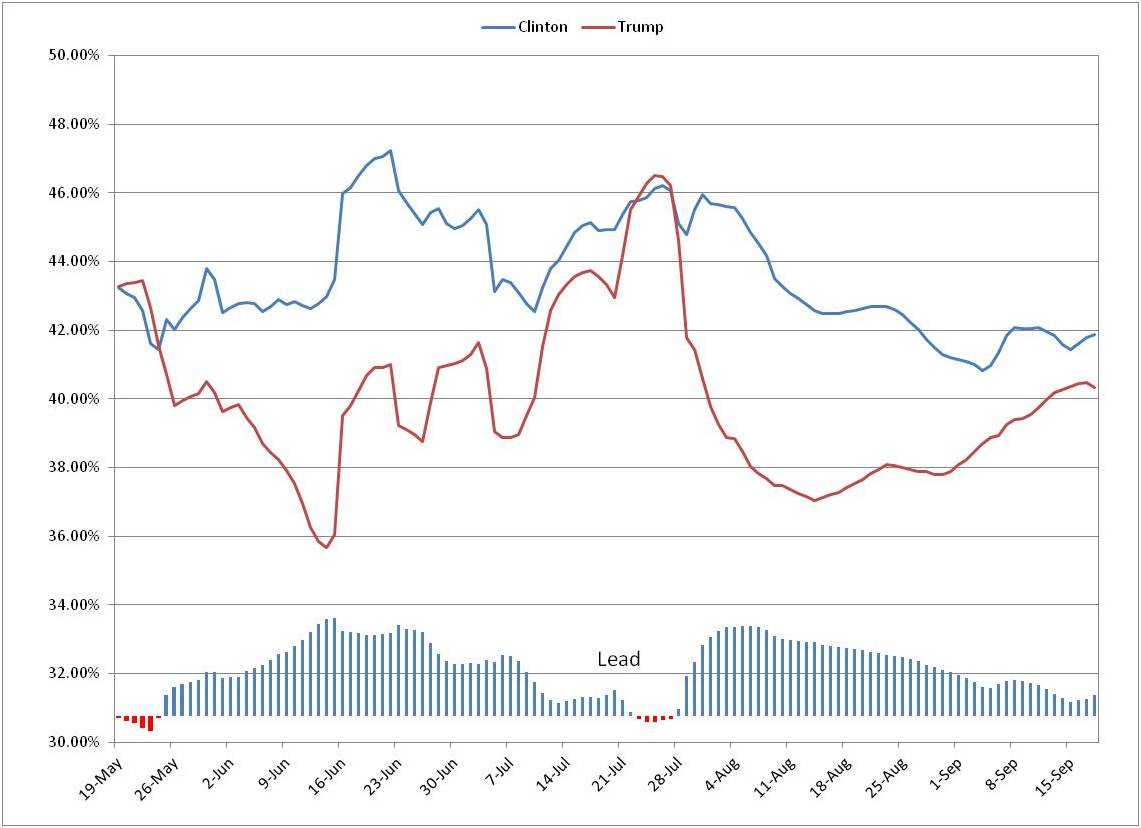
Donald Trump had a great couple of months between 8/7 and 9/12 where he cut Hillary Clinton’s lead from 6.8% to 2.0% on a very slow but consistent basis. For the last week, the race has come to a standstill as Clinton made it back to the campaign trail from her brief pneumonia episode and the lead has fluctuated between 1% and 2% (It is currently at 1.6%). It will likely be out of that range this time next week after Monday’s debates. Which direction it moves is anybody’s guess.
Here is a trend of the polls:
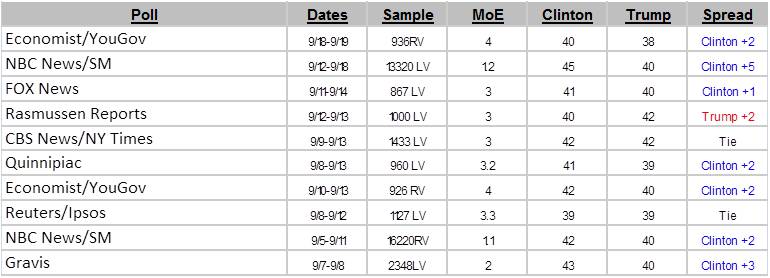
Here are the last 10 polls:
Of course the election is not about national polls and popular votes. It’s about the electoral college. Please see previous posts or click below for updated state by state forecast of the electoral outcome.
Click here for a state by state forecast of the elections
Click here for running list of forecast changes
Click here for results from last 5 elections
Follow me @2016ElectOdds for updates
Methodology:
- Use national polls listed at Real Clear Politics
- Weigh the outcomes by the sample size of each poll
- Account for the different days spanned for the poll by allocating it out across the days.
- Example a poll of 1000 voters taken across 7/2-7/5 would have a weighting of 250 voters for each of those days
- For each day, take the previous weighted 7 days worth of poll data to compute a percentage for each candidate. The rolling 7 days decreases the impact of large polls taken on a single day (large sample electronic polls)
Views – 663

